Adaptive Remeshing (GMSH)#
The RemeshingStrategies can be passed to a GMSH remesher.
from pathlib import Path

import matplotlib.pyplot as plt
import meshio
import numpy as np
import shapely

from meshwell.cad_occ import cad_occ
from meshwell.mesh import mesh
from meshwell.occ_xao_writer import write_xao
from meshwell.polysurface import PolySurface
from meshwell.remesh import (
    BinaryScalingStrategy,
    remesh_gmsh,
)
from meshwell.visualization import plot2D
/home/runner/work/meshwell/meshwell/.venv/lib/python3.12/site-packages/tqdm/auto.py:21: TqdmWarning: IProgress not found. Please update jupyter and ipywidgets. See https://ipywidgets.readthedocs.io/en/stable/user_install.html
  from .autonotebook import tqdm as notebook_tqdm
Define Geometry#
We define two adjacent rectangles with different physical tags.
# Define geometry
large_rect = 10
mid_rect = 2

# Box 1: inner box
polygon1 = shapely.Polygon(
    [
        [-large_rect / 2, -mid_rect / 2],
        [large_rect / 2, -mid_rect / 2],
        [large_rect / 2, mid_rect / 2],
        [-large_rect / 2, mid_rect / 2],
        [-large_rect / 2, -mid_rect / 2],
    ],
)

# Box 2: global box
polygon2 = shapely.Polygon(
    [
        [-large_rect / 2, -large_rect / 2],
        [large_rect / 2, -large_rect / 2],
        [large_rect / 2, large_rect / 2],
        [-large_rect / 2, large_rect / 2],
        [-large_rect / 2, -large_rect / 2],
    ],
)

poly_obj1 = PolySurface(
    polygons=polygon1,
    mesh_order=1,
    physical_name="inner_box",
)
poly_obj2 = PolySurface(
    polygons=polygon2,
    mesh_order=2,
    physical_name="outer_box",
)

entities_list = [poly_obj1, poly_obj2]

# Generate CAD
write_xao(cad_occ(entities_list), "remesh_example.xao")
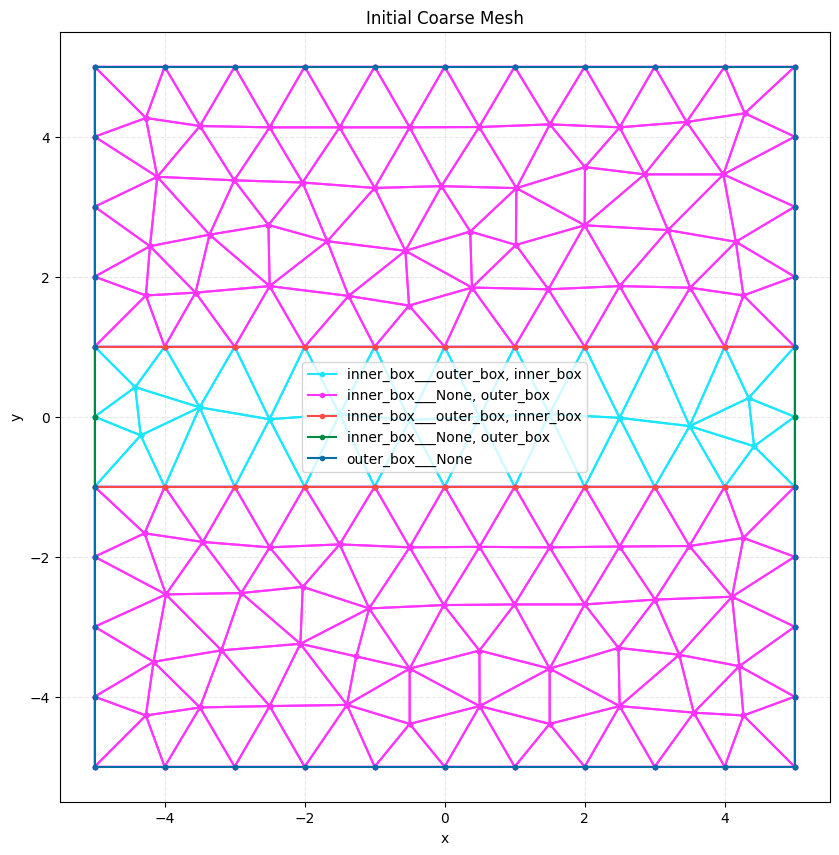
Initial Mesh#
We generate a coarse initial mesh.
# Generate initial mesh
initial_mesh = mesh(
    dim=2,
    input_file="remesh_example.xao",
    output_file="remesh_example_initial.msh",
    default_characteristic_length=1.0,  # Coarse mesh
    n_threads=1,
)

print(f"Initial mesh points: {len(initial_mesh.points)}")
plot2D(initial_mesh, title="Initial Coarse Mesh", wireframe=True)
Info    : Clearing all models and views...
Info    : Done clearing all models and views
Info    : Reading 'remesh_example.xao'...
Info    : Done reading 'remesh_example.xao'
Initial mesh points: 148
Define Remeshing Strategy#
We define a strategy that refines the mesh along an oval shape. The strategy function calculates a solution/error (e.g., distance from boundary), and if it exceeds a threshold, refinement is triggered.
# Define oval parameters
center_x, center_y = 0.0, 0.0
radius_x, radius_y = 3.0, 3.0


def oval_looking_data(coords, _data=None):
    """Calculate solution/error based on proximity to oval boundary.

    Returns 1.0 if close to boundary, 0.0 otherwise.
    """
    x = coords[:, 0]
    y = coords[:, 1]

    # Normalized distance from center
    normalized_dist = ((x - center_x) ** 2 / radius_x**2) + (
        (y - center_y) ** 2 / radius_y**2
    )
    dist_from_boundary = np.abs(np.sqrt(normalized_dist) - 1.0)

    # Invert distance: high value near boundary
    # e.g., 1.0 at boundary, decaying to 0.0 at distance 1.0
    return np.maximum(0, 1.0 - dist_from_boundary)
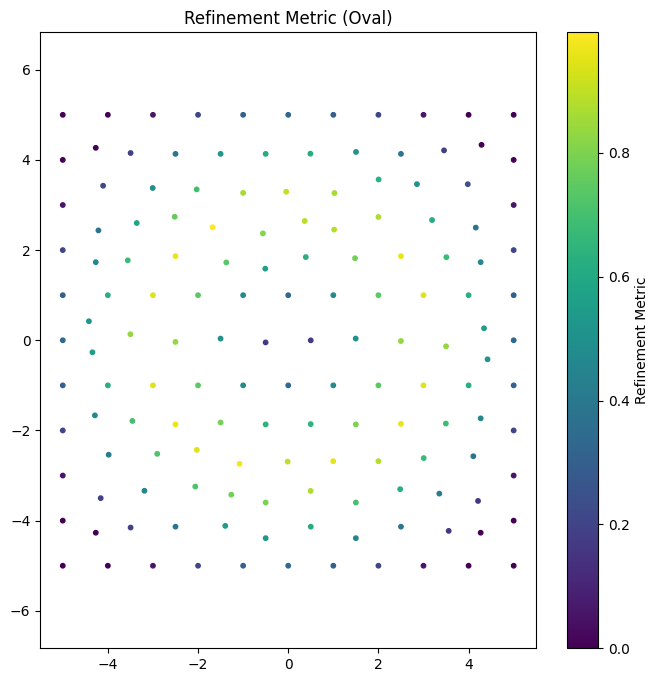
Visualize Metric Field#
We can visualize the solution/error field on the initial mesh to see where refinement will occur.
# Calculate solution/error on initial mesh points
data_values = oval_looking_data(initial_mesh.points)
plt.figure(figsize=(8, 8))
plt.scatter(
initial_mesh.points[:, 0],
initial_mesh.points[:, 1],
c=data_values,
cmap="viridis",
s=10,
)
plt.colorbar(label="Refinement Metric")
plt.title("Refinement Metric (Oval)")
plt.axis("equal")
plt.show()
# refinement_data as (N, 4) -> x, y, z, data
refinement_data = np.column_stack([initial_mesh.points, data_values])
# Create strategy with refinement_data
strategy = BinaryScalingStrategy(
func=oval_looking_data,
threshold=0.7,
factor=0.2,
refinement_data=refinement_data,
min_size=0.1,
max_size=2.0,
field_smoothing_steps=2,
)
size_map = remesh_gmsh(
input_mesh=Path("remesh_example_initial.msh"),
geometry_file=Path("remesh_example.xao"),
output_mesh=Path("remesh_example_final.msh"),
strategies=[strategy],
dim=2,
verbosity=0,
n_threads=1,
)
plt.figure(figsize=(8, 8))
# size_map is (N, 4) -> x, y, z, size
sc = plt.scatter(
size_map[:, 0], size_map[:, 1], c=size_map[:, 3], cmap="viridis_r", s=5
)
plt.colorbar(sc, label="Target Mesh Size")
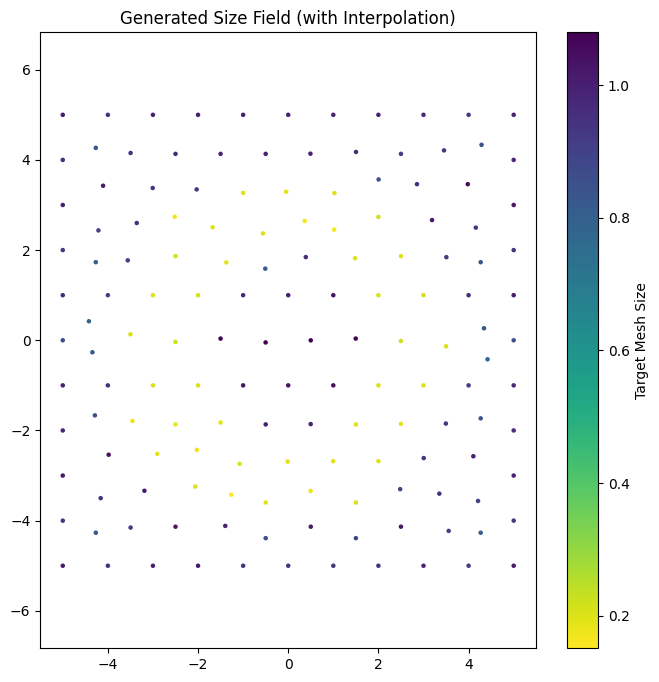
plt.title("Generated Size Field (with Interpolation)")
plt.axis("equal")
plt.show()
final_mesh = meshio.read("remesh_example_final.msh")
print(f"Final mesh points: {len(final_mesh.points)}")
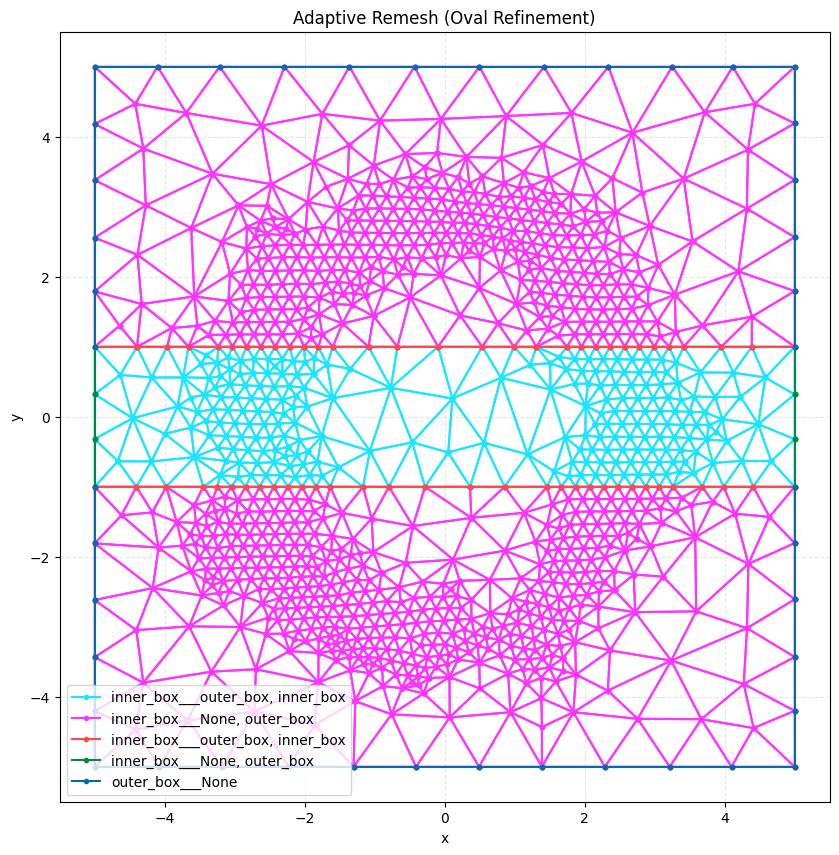
plot2D(final_mesh, title="Adaptive Remesh (Oval Refinement)", wireframe=True)
Info    : Reading 'remesh_example_initial.msh'...
Info    : 21 entities
Info    : 148 nodes
Info    : 314 elements
Info    : Done reading 'remesh_example_initial.msh'
Info    : Clearing all models and views...
Info    : Done clearing all models and views
Info    : Reading 'remesh_example.xao'...
Info    : Done reading 'remesh_example.xao'
Final mesh points: 1095
Perform Remeshing with Finer Grid Evaluation#
To capture the oval shape more accurately, we can evaluate the solution/error on a dense grid of points in addition to the mesh nodes. This ensures that features smaller than the initial mesh elements are detected.
# Generate a dense grid of points
x = np.linspace(-large_rect / 2, large_rect / 2, 100)
y = np.linspace(-large_rect / 2, large_rect / 2, 100)
X, Y = np.meshgrid(x, y)
grid_coords = np.column_stack([X.ravel(), Y.ravel(), np.zeros_like(X.ravel())])

# Evaluate solution/error on the grid
grid_data = oval_looking_data(grid_coords)

# refinement_data as (N, 4) -> x, y, z, data
grid_refinement_data = np.column_stack([grid_coords, grid_data])

# Create strategy with grid refinement data
grid_strategy = BinaryScalingStrategy(
    threshold=0.8,
    factor=0.2,
    refinement_data=grid_refinement_data,
    min_size=0.1,
    max_size=2.0,
    field_smoothing_steps=5,
)

size_map = remesh_gmsh(
    input_mesh=Path("remesh_example_initial.msh"),
    geometry_file=Path("remesh_example.xao"),
    output_mesh=Path("remesh_example_final.msh"),
    strategies=[grid_strategy],
    dim=2,
    verbosity=0,
    n_threads=1,
)
Info    : Reading 'remesh_example_initial.msh'...
Info    : 21 entities
Info    : 148 nodes
Info    : 314 elements
Info    : Done reading 'remesh_example_initial.msh'
Info    : Clearing all models and views...
Info    : Done clearing all models and views
Info    : Reading 'remesh_example.xao'...
Info    : Done reading 'remesh_example.xao'
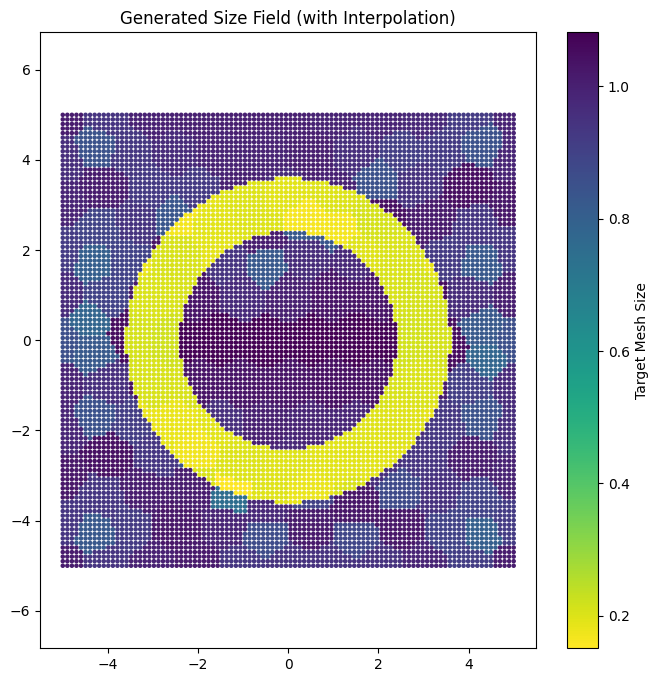
Visualize Size Field#
We can visualize the generated size field, including interpolated points.
plt.figure(figsize=(8, 8))
# size_map is (N, 4) -> x, y, z, size
sc = plt.scatter(
    size_map[:, 0], size_map[:, 1], c=size_map[:, 3], cmap="viridis_r", s=5
)
plt.colorbar(sc, label="Target Mesh Size")
plt.title("Generated Size Field (with Interpolation)")
plt.axis("equal")
plt.show()
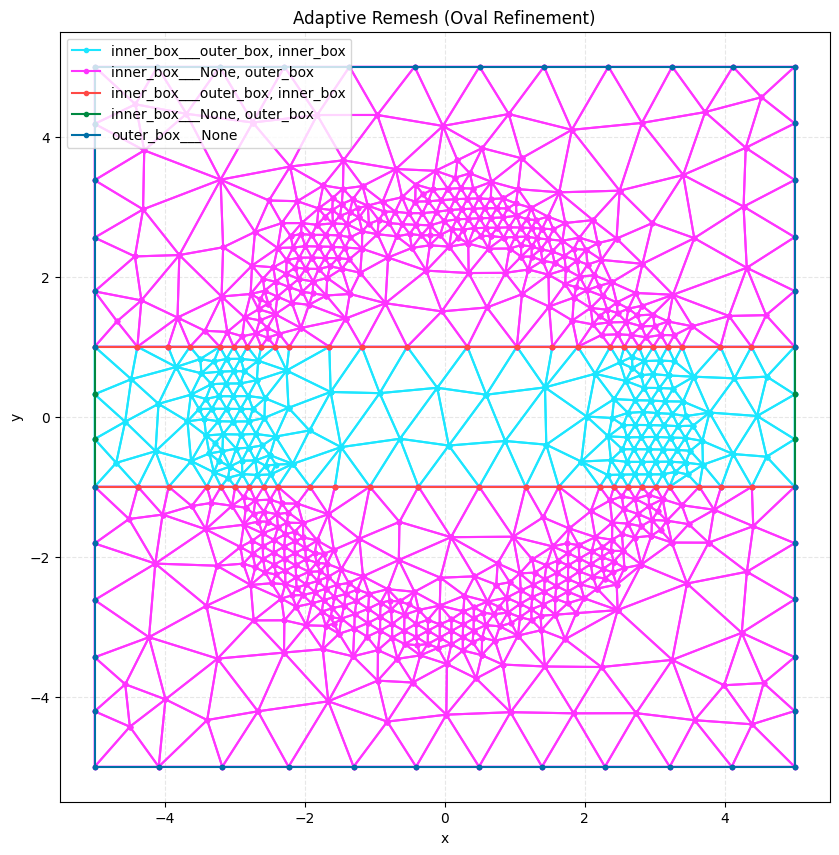
Visualize Result#
We load and plot the final mesh to see the refinement.
final_mesh = meshio.read("remesh_example_final.msh")
print(f"Final mesh points: {len(final_mesh.points)}")

plot2D(final_mesh, title="Adaptive Remesh (Oval Refinement)", wireframe=True)
Final mesh points: 775
Multiple Strategies#
We can combine multiple strategies to refine different regions. Here we’ll refine around a circle and along a vertical line.
# Define circle parameters
circle_center_x, circle_center_y = 2.0, 2.0
circle_radius = 1.5


def circle_looking_data(coords, data=None):
    """Calculate solution/error based on proximity to circle boundary."""
    if data is not None:
        return data

    x = coords[:, 0]
    y = coords[:, 1]

    # Distance from circle center
    dist_from_center = np.sqrt((x - circle_center_x) ** 2 + (y - circle_center_y) ** 2)
    dist_from_boundary = np.abs(dist_from_center - circle_radius)

    # High value near boundary
    return np.maximum(0, 1.0 - dist_from_boundary / 0.5)


# Define line parameters (vertical line at x = -2)
line_x = -2.0
line_width = 0.3


def line_looking_data(coords, data=None):
    """Calculate solution/error based on proximity to vertical line."""
    if data is not None:
        return data

    x = coords[:, 0]

    # Distance from line
    dist_from_line = np.abs(x - line_x)

    # High value near line
    return np.maximum(0, 1.0 - dist_from_line / line_width)


# Generate evaluation points for circle
x_circle = np.linspace(-large_rect / 2, large_rect / 2, 80)
y_circle = np.linspace(-large_rect / 2, large_rect / 2, 80)
X_circle, Y_circle = np.meshgrid(x_circle, y_circle)
circle_coords = np.column_stack(
    [X_circle.ravel(), Y_circle.ravel(), np.zeros_like(X_circle.ravel())]
)
circle_data_values = circle_looking_data(circle_coords)
circle_refinement_data = np.column_stack([circle_coords, circle_data_values])

# Generate evaluation points for line
x_line = np.linspace(-large_rect / 2, large_rect / 2, 80)
y_line = np.linspace(-large_rect / 2, large_rect / 2, 80)
X_line, Y_line = np.meshgrid(x_line, y_line)
line_coords = np.column_stack(
    [X_line.ravel(), Y_line.ravel(), np.zeros_like(X_line.ravel())]
)
line_data_values = line_looking_data(line_coords)
line_refinement_data = np.column_stack([line_coords, line_data_values])

# Create strategies
circle_strategy = BinaryScalingStrategy(
    func=circle_looking_data,
    threshold=0.5,  # Lower threshold to refine more area
    factor=0.15,  # Stronger refinement (smaller factor)
    refinement_data=circle_refinement_data,
    min_size=0.05,  # Much smaller minimum size
    max_size=2.0,
    field_smoothing_steps=5,
)

line_strategy = BinaryScalingStrategy(
    func=line_looking_data,
    threshold=0.4,  # Lower threshold to refine more area
    factor=0.2,  # Stronger refinement
    refinement_data=line_refinement_data,
    min_size=0.08,  # Much smaller minimum size
    max_size=2.0,
    field_smoothing_steps=5,
)

# Combine both strategies
multi_size_map = remesh_gmsh(
    input_mesh=Path("remesh_example_initial.msh"),
    geometry_file=Path("remesh_example.xao"),
    output_mesh=Path("remesh_example_multi.msh"),
    strategies=[circle_strategy, line_strategy],
    dim=2,
    verbosity=0,
    n_threads=1,
)
Info    : Reading 'remesh_example_initial.msh'...
Info    : 21 entities
Info    : 148 nodes
Info    : 314 elements
Info    : Done reading 'remesh_example_initial.msh'
Info    : Clearing all models and views...
Info    : Done clearing all models and views
Info    : Reading 'remesh_example.xao'...
Info    : Done reading 'remesh_example.xao'
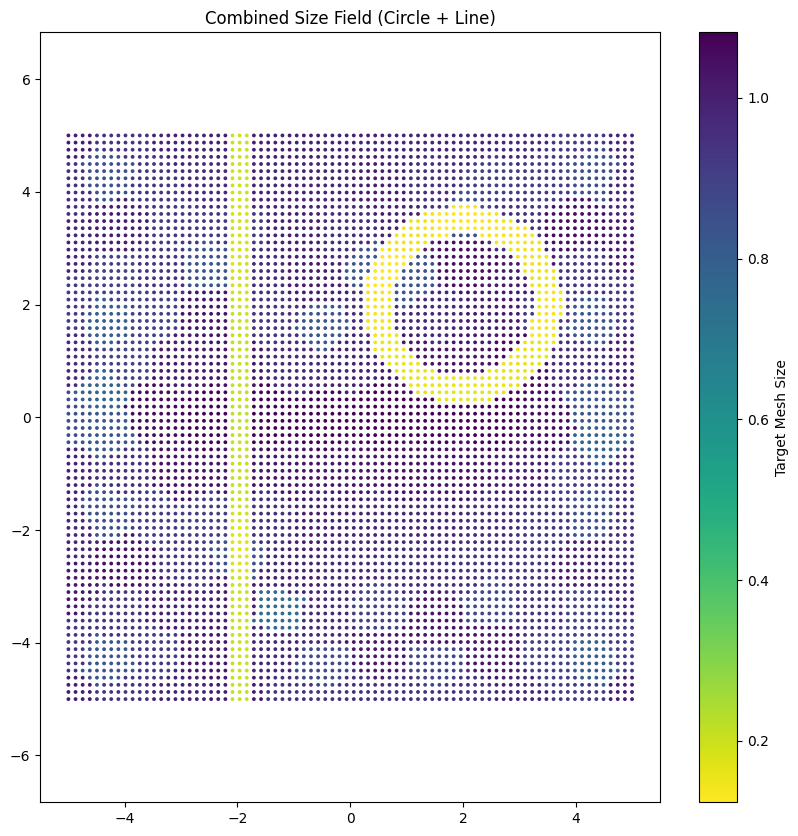
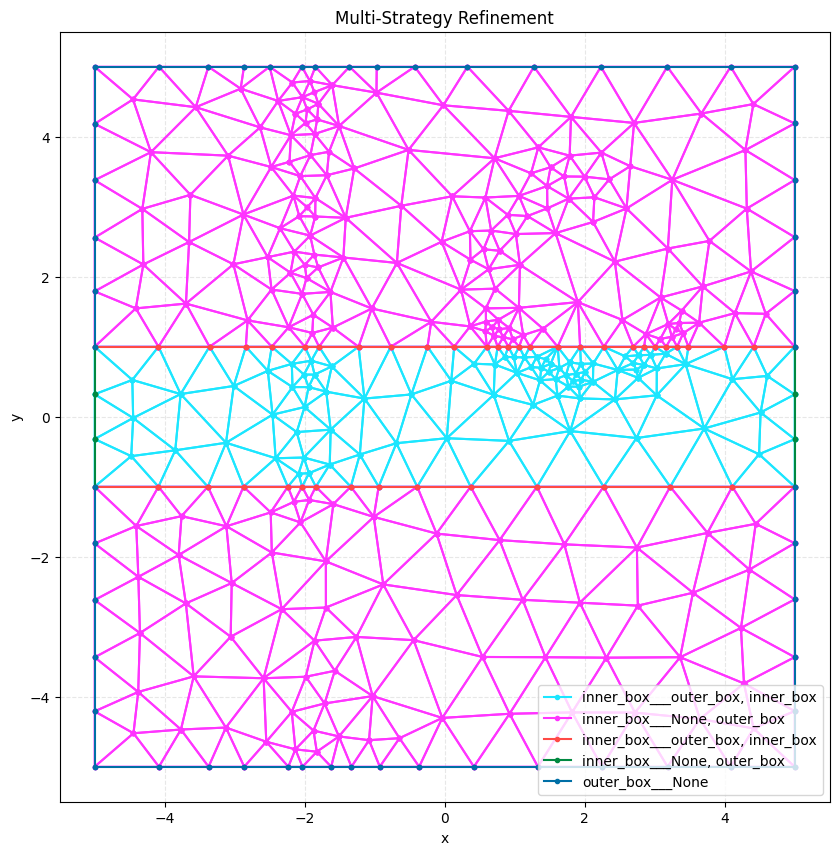
Visualize Multi-Strategy Result#
# Visualize the combined size field
plt.figure(figsize=(10, 10))
sc = plt.scatter(
    multi_size_map[:, 0],
    multi_size_map[:, 1],
    c=multi_size_map[:, 3],
    cmap="viridis_r",
    s=3,
)
plt.colorbar(sc, label="Target Mesh Size")
plt.title("Combined Size Field (Circle + Line)")
plt.axis("equal")
plt.show()

# Load and visualize the final mesh
multi_mesh = meshio.read("remesh_example_multi.msh")
print(f"Multi-strategy mesh points: {len(multi_mesh.points)}")
plot2D(multi_mesh, title="Multi-Strategy Refinement", wireframe=True)
Multi-strategy mesh points: 383
# Clean up files
for f in [
    "remesh_example.xao",
    "remesh_example_initial.msh",
    "remesh_example_final.msh",
    "remesh_example_multi.msh",
    "remesh_example_3d.xao",
    "remesh_example_3d_initial.msh",
    "remesh_example_3d_final.msh",
]:
    if Path(f).exists():
        Path(f).unlink()
Path("remesh_example_direct.msh").unlink(missing_ok=True)